Student Research Project Idea:
Surface Reflectance for Monitoring the Health of Vegetation
Research Questions:
How can surface reflectance be used to monitor the status of vegetated surfaces? How does the surface reflectance of various
surfaces change with season, soil moisture content, or other conditions? Is it possible to build an inexpensive instrument that will produce data
comparable to the normalized differential vegetation index?
Brief Background:
Understanding the health of vegetation on Earth's surface is important for climate scientists, but also for many
other reasons. From a climate change perspective, global space-based measurements are needed to track the shifting characteristics
of vegetation (such as crops and forests) in response to climate change. These changes can be both a result of and a cause of climate change.
For example, these measurements can be used to monitor the status of
tropical forests such as the Amazon, which are so important to the environmental health of our planet, or the progress of
desertification in Africa in response to changing land use and weather patterns.
It is not only the environmental health of our planet that depends so critically on the health of vegetation. There
are political and economic consequences, too. Areas where droughts or other natural disasters significantly impact agriculture
can quickly become politically unstable trouble spots. Entire populations can be stressed by changes in vegetation, leading
to huge refugee problems that may require a response from the international community. Sometimes, especially in areas where
"mono-crop" agriculture is dominant, very small changes in climate can produce very large changes in the success of
agricultural operations — critical to global food supplies and to the stability of developing countries whose
economies depend heavily on agriculture.
Indeed, although it is easy to take it for granted, the status of vegetation impacts all of our lives, regardless
of whether climate is changing or not!
|
In order to monitor the health of vegetation, scientists define the Normalized Difference Vegetation Index
(NDVI):
NDVI = (NIR - VIS)/(NIR + VIS)
where NIR and VIS are the surface reflectances in the near-infrared and visible. This quantity can have values between -1 and +1.
The NDVI
is based on the observation that vegetation has significantly different reflectance in the visible and near-IR parts of the
electromagnetic spectrum. The reflectance of healthy vegetation is relatively higher in the near-IR and lower
in the visible than unhealthy (or more sparse) vegetation. Very dense and healthy vegetation will have an NDVI approaching 1.
The NDVI for bare soils tends to be about the same in the VIS
and NIR, producing NDVI values near 0 and, in principle, even less than 0. Other surfaces such as open water
or snow can give negative values.
The NDVI calculated from space-based
measurements of surface reflectance can be used to construct global vegetation maps.
Locally, on the ground, this same measurement can be used to monitor changes in vegetation over a small
area, in response to time of year, temperature, precipitation, and soil conditions. Two of the inexpensive pyranometers developed by the
Institute for Earth Science Research and Education can be used to measure broadband surface reflectance, with
one instrument pointed up and the other down at the ground. These instruments do not need an absolute radiometric calibration,
as is required for measuring insolation (the total solar energy reaching a horizontal surface). It is required only to calibrate
one instrument relative to the other.
|  |
| A two-channel version of this instrument is also described on IESRE's website.
Both detectors use the same small silicon solar cell, about 2×2 mm, that responds to visible (400-700 nm) and near-IR radiation (700-1200 nm).
(This tiny solar cell is basically the
same as much larger solar cells used for generating power from sunlight.) The two detectors are identical except that the near-IR
version has a black housing that blocks visible radiation. Remember that these photodetectors are current-producing devices. An easily
measurable and recordable output signal is obtained by measuring the voltage across a 500-Ohm 1% tolerance metal film resistor built into these
instruments.
Even though the spectral response of these two detectors overlap, there is
still a considerable
difference in the reflectance of healthy grass, as shown in the graph below. The graph was produced by walking across a flagstone patio,
a gravel driveway, and a
grassy lawn, and back, with a pair of two-channel instruments and recording measurements at one-second intervals.
Note that the broadband and near-IR reflectances are nearly identical over
two non-vegetated surfaces. These two detectors could be used to calculate an index I:
Ibroadband NDVI = (NIR - broadband)/(NIR + broadband) |
|
 |
But, how can this index be interpreted? Does it give results comparable to the NDVI? A way to answer this question is to build
another instrument with a filter over the broadband detector that blocks near-IR wavelengths.
For example, the specifications for the
the 12.5mm diameter NT55-234 filter from Edmund Optics are:
Front Surface: T=85%, 480nm-680nm, T=10%, 740nm-1200nm, T=50%, 680nm-740nm
That is, the filter blocks nearly all near-IR radiation, while passing almost all visible radiation
With this modification, the two-channel radiometer
should produce data from which the NDVI can be calculated. But, this filter costs $42 as of summer 2011, about
four times the cost of all the other parts for the two-channel radiometer combined!
Is the extra cost worth it? If we have two pairs of instruments measuring the same area, one with near-IR filters over its
broadband detectors and one without, will the
instruments with the filter give results that are more sensitive to changes in the status of vegetation?
For the reflectance graph shown here, a U12-006 12-bit 0-2.5V data logger from Onset Computer Corporation was used to record the instrument outputs.
The pyranometer detectors produce about 0.2 V in full sunlight, but typically less than 0.05 V when measuring reflected radiation
from a surface. This logger is adequate for measuring insolation, but
the analog-to-digital resolution for measuring reflectance, with such a small signal relative to the range of the data logger,
is only minimally adequate.
A solution is to amplify the
signal from the detectors using a current-to-voltage circuit called a transimpedance amplifier. You can find instructions for
building a transimpedance amplifier
here. Note that for this
circuit, the resistor across the detector leads must be removed. |
 |
Calibrating a Two-Channel Reflectometer
|
As noted above, reflectometers do not need an absolute radiometric calibration. One needs to
be calibrated relative to the other. Also as noted, with the data loggers I use,
the small signals from unamplified silicon-based detectors pointed downward
will be insufficient to record reflectance values accurately from most surfaces (except, perhaps, for snow!).
A year or so ago, when I first decided to build a reflectometer using the near-IR and unfiltered
broadband detectors, I designed (and had fabricated commercially) a pc board for a four-channel
transimpedance amplifier, using two dual-channel LTC1051
op amps. These op amps are high-quality, low-noise devices that I have used for many years in sun photometers, and
they are still available in a convenient 8-pin DIP configuration (rather than a surface mount configuration,
which is VERY difficult to work with).
I had to no idea about how large the gain resistors should be for the near-IR and filtered broadband channels
— maybe a few kΩ?
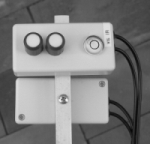
To facilitate testing, I assembled one side of a transimpedance amplifier pc board, using push-in
connectors where the resistors go. (They are the small brown rectangles between the battery pack and the screw-down
terminal strip.)
Then I just connected the detectors to the inputs and tried resistors in very bright sunlight until I got
gains that would approach the 2.5 V limit on the data logger, but would never exceed it. I took into account
the fact that the gains from these detectors can vary a little from sample to sample. Also, experience with
pyranometer data shows that sometimes reflections from the sides of clouds can cause outputs
that are momentarily even higher than the clear-sky value, so it is important not to try to "push" the
gain right up to
the limit of the data logger. I am looking for gains that would produce an output in the 1.5V range under
a clear sky, but no higher.
|  |
Here's the relative calibration setup. It's not pretty, but it doesn't need to be!
The filtered VIS detectors, with their larger Teflon diffusers, are on the right of the cases. (In the top case
you can see a repair I made to fill the hole for a bubble level, which needed to be on the bottom of this case, which will become
the down-pointing device. I always try to recycle my mistakes!)
The HOBO U12-006 logger is at the right. The input plugs are attached to a little perfboard setup with screw-down
terminals to which the outputs from the transimpedance amplifiers are connected. When the testing is complete, the colored
wire leads from the four amplifier outputs will be replaced with cables and plugs for the data logger.
The enlarged photo of the amplifier shows how the detector leads are connected. As a
matter of convention, red wires are always on the "+" side of the detector -- the long lead. However,
because of the way transimpedance amplifiers work, the detectors are hooked up "backwards" with the "+" leads
connected to a common (COM) terminal.
If you look closely, you may think that the op amps are "upside down" on the pc board.
Relative to the lettering on the board, they are, but this is their proper orientation in the circuit! |
 |  |
|
The graphs below show the data collected with the setup shown above on a very hot, hazy, and partly cloudy day. The gain resistors are 3.9 kOhm for the filtered
VIS channel and 3.3 kOhm for the IR channel. The lefthand graph shows the raw voltages.
Until early afternoon, the detectors are shaded by a large umbrella over the table shown in the image.
I did this on purpose to get data under a wide range of diffuse sky and direct sun lighting conditions. The gain could still be raised a little on all channels of this pair of instruments (by increasing the value of the gain resistors),
but these instruments are certainly usable as-is. The #1 instrument will face down, to measure solar radiation reflected from the underlying surface, and the
#2 instrument will face straight up to monitor incoming solar radiation. The righthand graph shows the relative calibration. It has been assumed that the
#2 instrument will be the "reference" and calibration constants will be determined to make the outputs from each channel of the #1 instrument agree with
the corresponding channel on the #2 instrument. Note that the relative size of the VIS and IR channels is arbitrary in the sense that it is
determined by the amplifier gain rather than any inherent differences between the solar input in these two spectral ranges.
|
 |  |
The results are:
multiply the output from the filtered VIS channel of the #1 instrument by 0.825
multiply the output from the IR channel of the #1 instrument by 1.245
For calibrating one of these instruments relative to another, it is appropriate to do an "eyeball" calibration in Excel, just by manually
changing the calibration constant until one set of data
"disappears" behind the other; this is very easy and quick to do. The data from around 2:00 in the afternoon, when there are very large swings in output
as the shadow from the edge of the umbrella moved across the detectors to expose them to sunlight, can be ignored. If taken into account, they might skew
a more mathematical "least squares" approach to determining a
calibration coefficient.
Note that the outputs from these two instruments are significantly different even though they are physically and electronically equivalent. After testing,
the carbon film resistors could be replaced by equivalent metal film resistors. The advantage of metal film resistors is not that they have tighter tolerances,
typically 1% rather than 5%, but that they have a much lower temperature coefficient. Hence, the gain of the circuit is more stable because it
is less dependent on ambient temperature. But, the outputs from the detectors themselves will always differ from sample to sample, so a relative
calibration for each pair of instruments is always required.
Because of the filter that blocks almost all near-IR radiation from reaching the broadband detector, this detector can no longer be calibrated
for use as a broadband pyranometer. It might be interesting to try calibrating some combination of the outputs from the VIS and IR channels to a reference
pyranometer. Then, perhaps the upward-facing radiometer could be used to measure insolation at the site, too.
Is a Near-IR Filter Necessary?
As noted previously, the addition of a near-IR filter over the broadband channel is a way to separate out the visible and near-IR radiation.
But, this filter is relatively expensive. Is it worth it? Can the outputs from an instrument using unfiltered broadband and near-IR
detectors produce results that are as useful as outputs from an instrument using a filtered broadband and near-IR detector?
An approach suggested above is to calculate an index I using the outputs from the broadband and near-IR detectors. (We could call this a "broadband NDVI" index.)
This is a simple solution because it doesn't require any filtering for the detectors. But, the result is not the same as the
NDVI based on VIS and NIR channels.
Define these quantities:
VBB1, signal from the downward-pointing broadband detector
VIR1, signal from the downward-pointing near-IR detector
VBB2, signal from the upward-pointing broadband detector
VIR2, signal from the upward-point broadband near-IR detector
CBB (BB1 → BB2), a calibration constant that is multiplied times the VBB1 signal to make it agree with the VBB2 signal when both detectors are pointed up (at the sun)
CIR (IR1 → IR2), a calibration constant that is multiplied times the VIR1 signal to make it agree with the VIR2 signal when both detectors are pointed up (at the sun)
BBreflectance = VBB2/(CBB•VBB1)
IRreflectance = VIR2/(CIR•VIR1)
Then we can define a broadband NDVI:
Ibroadband NDVI = (IRreflectance - BBreflectance/ (IRreflectance + BBreflectance)
The NDVI defined above for healthy vegetation, based on IR and VIS reflectances, is presumed to be a positive number based
on the assumption that the IR reflectance over a vegetated surface is always larger than the VIS reflectance. It is not necessarily
obvious that that IR reflectance will always be larger than the total broadband reflectance. However, the graph shown above,
including data collected over a grassy surface, indicates that this still will be true for vegetated surfaces. Note that for
the reflectances observed over flagstone and gravel surfaces, the broadband NDVI calculation over non-vegetated surfaces
can give small positive or negative values.
 What is the relationship between NDVI and Ibroadband NDVI? Some insight into this question can be found in asking what the
output from unfiltered broadband and near-IR detectors should be for solar energy reaching Earth's surface. In general, this is a difficult question,
but it is not difficult to answer for clear-sky conditions using a radiative transfer model. The SMARTS2 model, developed by Christian Gueymard, is available
from the National Renewable Energy Laboratory at no cost as a stand-alone computer program that will run on Windows computers. The graph
shows the response for a spectrally flat detector, an unfiltered broadband detector, and a near-IR detector. The output of the broadband and near-IR
detectors is a function of the spectral
distribution of solar radiation but also of the response of each detector. Both detectors are influenced significantly by the large water vapor absorption band in the near-IR around
940 nm. Integrating the area under each of the detector curves and taking the ratio of the near-IR to broadband detector
gives a value of 0.535 for a relative air mass of 2 (sun at an elevation angle of 30°) and 0.529 for a relative air mass of 1 (sun overhead).
What is the relationship between NDVI and Ibroadband NDVI? Some insight into this question can be found in asking what the
output from unfiltered broadband and near-IR detectors should be for solar energy reaching Earth's surface. In general, this is a difficult question,
but it is not difficult to answer for clear-sky conditions using a radiative transfer model. The SMARTS2 model, developed by Christian Gueymard, is available
from the National Renewable Energy Laboratory at no cost as a stand-alone computer program that will run on Windows computers. The graph
shows the response for a spectrally flat detector, an unfiltered broadband detector, and a near-IR detector. The output of the broadband and near-IR
detectors is a function of the spectral
distribution of solar radiation but also of the response of each detector. Both detectors are influenced significantly by the large water vapor absorption band in the near-IR around
940 nm. Integrating the area under each of the detector curves and taking the ratio of the near-IR to broadband detector
gives a value of 0.535 for a relative air mass of 2 (sun at an elevation angle of 30°) and 0.529 for a relative air mass of 1 (sun overhead).
As long as this
ratio is reasonably constant under a variety of sky conditions, it is reasonable to hypothesize that
the broadband NDVI index should be not too
different from the NDVI index. This is a
hypothesis that can be tested by measuring reflectance simultaneously over the same surface —
one pair of instruments with an unfiltered broadband detector and
the other pair with a filtered broadband detector,
and calculating NDVI and Ibroadband NDVI. If there is a predictable relationship between vegetation
indices calculated with these
two different instruments, then the case has been made for using a broadband NDVI instrument rather than the more
expensive NDVI instrument with a filtered broadband detector. If there is not a predictable relationshiop, then the instrument with the filtered broadband detector is the "winner" in this experiment. Even in the latter case, however, the filtered broadband instrument described here is still inexpensive enough for student research investigations into the health of vegetation.
Some Results
The image at the right shows the test setup for measuring surface reflectance. A long aluminum arm is fastened
to a camera tripod with one pair of VIS-IR detectors pointing up and one pair pointing down over a
grassy area. The site is at 40°N, 75°W.
The lefthand graph below shows results from June 15, 2011, when the grass was healthy and green, if a little spare.
The output from the individual channels varies
quite a bit during the day, but the NDVI values remain relatively constant. Late in the afternoon,
shadowing of this site by trees produces erratic results which can reasonably be ignored. For this surface
the NDVI is about 0.47-0.48.
Later in the summer, as often happens this time of year, there was very little rain. This grassy area has only a very thin layer of
topsoil over clay and shale, So, it does not retain moisture. With no rain, the soil quickly dries
out and the grass turns brown. We would expect the
NDVI to decrease as a result. The righthand graph shows that by July 16, the NDVI has decreased
to a value of about 0.40.
For comparison, it is interesting to collect these data over a surface with no vegetation. The graph
below shows the NDVI calculation over a gravel driveway adjacent to the grassy surface.
For this surface, there should be little
difference in the VIS and IR reflectivity so the NDVI should much smaller than the value over a vegetated surface.
The data shown below (from a very cloud day) give NDVI calculation results that are
very different from a vegetated surface!

Questions for Additional Research
In addition to the technical "research methods" questions about differences between VIS-IR vs broadband-IR vegetation indices,
the data shown above suggest other research questions about
using and interpreting vegetation indices. How do soil
characteristics affect the ability of soil to hold moisture and keep vegetation healthy when there is no rain? How do vegetation indices
depend on the nature of the vegetation? Do index values depend on the height of the sensors above the vegetation? If so, how should a "standard" height
be established?
References:
IESRE's pyranometer website
Building a transimpedance amplifier
A website from Aligarh Muslim University in India
with an excellent summary description of the reflectance of various surfaces
Article about measuring the NDVI, from
NASA's Earth Observatory website
Wikipedia article about NDVI
Gueymard, Christian. SMARTS2, A Simple Model of the Atmospheric Radiative
Transfer of Sunshine: Algorithms and performance assessment. FSEC-PF-270-95,
Florida Solar Energy Center, University of Central Florida, 1995
User Interface: Simple Model of Atmospheric Radiative Transfer of Sunshine, WINDOWS version. National Renewable
Energy Laboratory, April 2003
Site for dowloading the SMARTS2 radiative transfer model (free, but requires registration)
For more information about this project, including building a radiometer with a near-IR filter and parts for building a transimpedance
amplifier, contact
David Brooks.