from a nearby site in The Hague.
Presented at the GLOBE 7th Annual Meeting, July 22-26, 2002, Chicago, Illinois, USA
David R. Brooks
PI, GLOBE Aerosol Monitoring Project
Drexel University, Philadelphia, Pennsylvania, USA
Forrest M. Mims III
Geronimo Creek Observatory
Seguin, Texas, USA
During the last few years, as reported regularly at these meetings, we have developed the GLOBE sun photometer to its current operational status. At the same time, there has been a surge of scientific interest in aerosol research that surpassed even our own expectations at the time we wrote our original proposal in 1997. This level of scientific interest provides many opportunities, but also presents new challenges. We are starting to accumulate interesting aerosol data from a few sites. Now, at the start of a new 3-year project, we need to address two challenges:
1. How can we expand the application of the basic GLOBE sun photometer concept (using LEDs as spectrally selective light detectors) to remain responsive to real science needs?
2. How can we increase the level and sophistication of teacher and student participation in this area of environmental science?
Where We Are Now: Selected GLOBE Aerosol Data
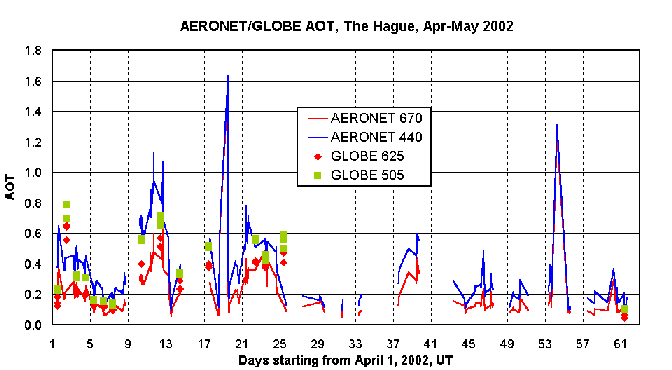
We present here two sets of GLOBE data from April and May, 2002. The first has been collected by students at the Christelijk College De Populier, The Hague, the Netherlands. The second set has been collected by Ana Christina Ferro Marques, a GLOBE teacher from Cape Verde (recently appointed as Cape Verdes GLOBE Country Coordinator), as part of the process of implementing a GLOBE program in her school. We have encouraged measurements at these sites because, in both cases, there are nearby AERONET sun photometers against which GLOBE data can be compared. There are only a few dozen active AERONET sites around the world, and we are fortunate to have GLOBE schools near some of them. Schools in the Netherlands started collecting sun photometer data earlier this year under the joint sponsorship of GLOBE/Netherlands and the Royal Netherlands Meteorological Institute (KNMI). By spring, some of these schools had overcome some initial obstacles and were collecting data on a regular basis. The results are shown in Figure 1.
|
| Figure 1. Comparison of GLOBE data from Christelijk College De Populier, The Hague,
the Netherlands, with AERONET data from a nearby site in The Hague. |
The Hague is a coastal city in the Netherlands. The Netherlands has many heavily industrialized cities and it is the most densely populated country in Europe. Hence, air quality is a serious environmental issue there, as it is in many other European countries. There is a lot of cloud cover over this part of Europe, so it is possible to go for many days without finding conditions under which sun photometer measurements can be made. Aerosol optical thickness values tend to be relatively high, compared with less heavily populated and industrialized areas in other parts of the world. The question we had when we first looked at data from the Netherlands was: Do the large AOT values really represent a hazy atmosphere in weather conditions that are suitable for sun photometry, or are many of these measurements contaminated by clouds? This question was especially important because the reported metadata often included descriptions of blue and clear skies even when AOT values were large (roughly, greater than 0.4-0.5) At least a partial answer to this question can be found by comparing the GLOBE measurements with measurements from a nearby AERONET CIMEL sun photometer. This is an automated sun photometer that makes measurements roughly every 15 minutes. (See http://aeronet.gsfc.nasa.gov:8080/.) Algorithms applied to the data attempt to screen all the measurements for cloud contamination. Thus, if AERONET data are available for a particular day and time, it seems reasonable to conclude that the AERONET instrument believed atmospheric conditions were suitable for calculating AOT. Note, however, that this conclusion is not necessarily valid, because accurate cloud discrimination algorithms are notoriously difficult to implement.
Figure 1 shows quite clearly the general agreement between GLOBE and AERONET measurements. In general, the GLOBE AOT values at 625 and 505 nm should lie between the AERONET values at 670 and 440 nm. The major discrepancy between AERONET and GLOBE data occurs in early April, and we attribute this discrepancy to unfamiliarity with the sun photometer. (Reporting a sun photometer voltage that is too low will cause the AOT value to be larger than it should be.) These data show the critical importance of consistent data collection and reporting all the metadata required for the aerosol protocol, even on days when sky conditions are not suitable for making sun photometer measurements. There are GLOBE data for April 17 (a Wednesday), but not for the next two days during the school week. AERONET reported very high AOT values on April 19 (a Friday), while the school reported no data? Why not? Was it because sky conditions werent suitable or because no one was available to collect data? Perhaps the AERONET data should be questioned (our guess). Only consistent and complete metadata reporting would answer this question.
Figure 2 shows GLOBE data from a completely different part of the world. Cape Verde is a group of small, arid islands about 500 km west of Senegal, off the West Coast of Africa. Cape Verde lies directly in the path of dust blowing from the Sahara Desert, westward across the Atlantic Ocean. (These storms are caused by the harmattan winds, which typically blow across the Sahara from the east-northeast.) Because of its strategic location for tracking these dust storms, which often reach North and Central America, there is an AERONET sun photometer on the island of Sal. This location is about 2 degrees (roughly 200 km) north of Praia (the capital of Cape Verde) where the GLOBE data were collected.
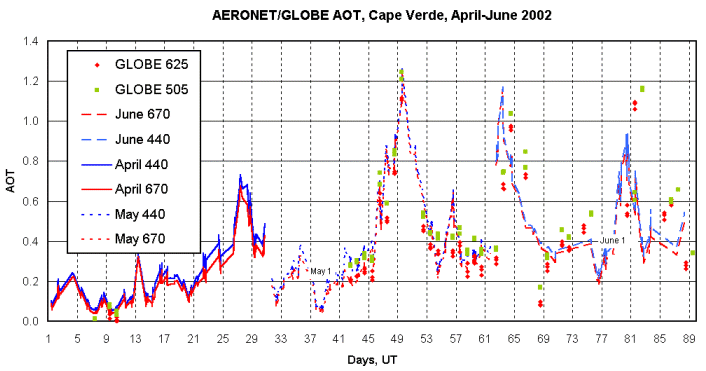 |
| Figure 2. GLOBE data from Praia, Cape Verde, compared to AERONET data from the island of Sal. |
These data are very interesting because they show measurements over an extraordinary range of AOT values. We considered the earliest measurements to be just training measurements for the protocol. Nonetheless, they still agree reasonably well with the low AOT values reported by AERONET. A major Saharan dust event occurred during May. Note the high level of agreement between GLOBE and AERONET data. This agreement is remarkable, given the large physical separation between the two observing sites. A reasonable conclusion would be that a very large and relatively uniform dust cloud passed over this region of the North Atlantic. Contrast the May dust event with a similar event in June. Here, there is agreement in the magnitude of the AOT values, but not in their timing. Given the good agreement with the previous large dust event, these differences could be interpreted as a result of north-to-south motion of the dust cloud. Such results again demonstrate the importance of good metadata. If wind speed and direction were available during this event, these values would aid in the interpretation of the data. (Neither wind speed nor direction are currently part of the GLOBE aerosol protocol.) They also demonstrate the justification for data collection over a long period of time, and for comparisons with other data sources whenever possible. A history of reliable measurements gives scientists the confidence they need to use data that might otherwise seem suspect.
We are very pleased with these results, as they clearly demonstrate that the GLOBE sun photometer works well under a wide range of conditions. The Netherlands data are especially instructive because they are the result of an ongoing science partnership between KNMI and the GLOBE Program.
We are now ready to begin our new 3-½-year project. Like all GLOBE science projects, the Aerosol Monitoring Project team includes both scientists and educators. We have tried to select a diverse group of people who can bridge the gap between those two disciplines.
The GLOBE sun photometer was originally conceived as a research instrument that would continue to evolve, rather than a static off-the-shelf commercial instrument. This was a fortuitous choice, because scientific interest in aerosols has created more opportunities than we imagined at the start of this project. However, new opportunities impose new requirements on instrumentation. Fortunately, the Aerosol Monitoring Project has supported an aggressive instrument and application development. The Aerosol Monitoring Project will continue to rely on the current two-channel GLOBE sun photometer as its basic data-gathering tool. However, our current printed circuit board design supports up to four detectors. As a result, we are able to propose several specific new projects to be implemented during the proposed grant period.
Automated data collection and temperature sensing
Ms. Stockman has been involved with GLOBEs soil protocol and she is also the Education and Public Outreach Coordinator for NASA/GSFCs EOS/Aura earth-monitoring mission. This program sponsors the student-based UV-A measurement project described elsewhere in this paper. For the current project, Ms. Stockman is responsible for the summer workshops that will be a major component of our neIt is not feasible for a GLOBE sun photometer to replicate the performance of automated sun photometers that track the sun and take continuous measurements; such instruments are too expensive and require too much maintenance to be used by GLOBE schools. However, it is feasible to include a simple computer interface that automatically records time and voltages from a sun photometer when it is manually pointed at the sun. This capability is important for two-channel aerosol measurements and for some of the proposed instrument modifications discussed below. We have already built prototype sun photometers with a 12-bit A/D converter and RS232 computer interface. Digital voltmeters with RS232 interfaces are also available for retrofitting existing GLOBE sun photometers. Either solution is relatively inexpensive (~US$75) and can be applied to other data-gathering projects. The purpose of automated recording of sun photometer measurements is not to increase the amount or frequency of data reporting, but to minimize manual transcription errors, simplify data entry, and enhance data quality by providing a permanent visual record of instrument response. A written protocol is being developed. LED detectors are temperature-sensitive, and some of those used in the projects described below are more sensitive than the red and green detectors used in the current two-channel sun photometer. We have already built sun photometer prototypes with an inexpensive integrated circuit sensor (~US$1) to monitor air temperature inside the case. This is easy to incorporate as a additional output channel in instruments that include automated data collection. With this information, empirical temperature correction algorithms can be applied during data analysis.
UV-A radiation
Ms. Stockman has been involved with GLOBEs soil protocol and she is also the Education and Public Outreach Coordinator for NASA/GSFCs EOS/Aura earth-monitoring mission. This program sponsors the student-based UV-A measurement project described elsewhere in this paper. For the current project, Ms. Stockman is responsible for the summer workshops that will be a major component of our neUltraviolet radiation at the ground is an important quantity that can be inferred from space-based ozone measurements. However, reliable ground truth data are essential for interpreting space-based data. We are already working with the EOS/Aura Science Team at NASA Goddard Space Flight Center to develop inexpensive LED-based UV-A detectors suitable for use by students. The GSFC instrument uses a GaN (gallium nitride) blue LED to measure full-sky radiation in the near-UV (UV-A), at about 375 nm, with a cutoff filter to eliminate response in the visible and a diffuser to improve cosine response. A removable collimator is included so that optical depth can be measured with the same detector. The full-sky measurement can be calibrated using theoretical models and data from satellite overflights on clear days. This project is a direct outgrowth of our GLOBE work with LED-based detectors and our 12-year record of monitoring total ozone and UV-B at Geronimo Creek Observatory, a designated TOMS and Terra overpass site. Reporting of UV-A data will be supported as a GLOBE Special Measurement starting in early 2003. One possibility is to use the NASA/GSFC instrument. Another possibility is simply to add the blue LED as a third channel to the existing GLOBE sun photometer. Aerosol optical thickness at 375 nm is a worthwhile addition to the two wavelengths already measured with the GLOBE sun photometer because it provides more information about the size distribution of aerosols, it is especially sensitive to smoke, and it is a close match to the phototropic response of plants. Field testing of the GSFC UV-A instrument has already begun. Field testing of a GLOBE version of this instrument will begin in 2003
Photosynthetically active radiation (PAR)
PAR is a fundamental quantity used to study the development and health of vegetation, and is closely related to GLOBEs phenology and budburst protocols. Not surprisingly, scientists are using space-based measurements to measure the radiation reflected from vegetated surfaces and to produce global models of PAR. We have already produced a six-year record of measurements (1996-2002) comparing full sky and direct sun measurements of PAR using blue and red LEDs with commercial PAR detectors. The correlation (r2) is about 0.97. A paper submitted by Mims [2002a] is under review. A brief explanation of how LED detectors can be used to measure PAR is available on our web site: http://www.mcs.drexel.edu/~dbrooks/globe/special_measurements/par.htm PAR measurements require a physical modification of the sun photometer configuration because the detectors must observe the entire sky. Especially in skies where clouds are present, it is important to examine the temporal variability of PAR by monitoring the full-sky radiation continuously over several minutes, rather than using the point measurements of the aerosol protocol. This instrument configuration, with automated data collection, is similar to the one developed for the NASA/GSFC UV-A project described in the previous section. We will support PAR measurements as a GLOBE Special Measurement starting in 2003.
Atmospheric water vapor
Water vapor suspended in the atmosphere can cause a significant increase in optical thickness. This phenomenon is especially common during warm weather. Although it may seem like a mundane quantity relative to other, more exotic, greenhouse gases, water vapor is actually very important. An AGU Special Report [1995] noted that [t]here are some aspects of the role of water vapor as a greenhouse gas that are not well understood, again mainly because we lack the necessary observations to test theoretical models. Monitoring long-term changes in water vapor, which are closely linked to other climate variations and trends, is needed to both predict and detect changes. Water vapor is measured routinely from space daily global water vapor images are provided by GOES satellites, for example. However, as usual, ground-based validation of space-based measurements is critical. Comparisons of aerosol optical thickness and water vapor provide an excellent topic for GLOBE student investigations.
The GLOBE sun photometer can easily be modified to detect water vapor without changing
its physical layout. A pair of LEDs having spectral responses inside and just outside the
near-IR water vapor absorption band can be added to channels 3 and 4 of the current pc
board. Alternatively, a separate water vapor instrument can be constructed simply by
replacing the LEDs in channels 1 and 2. The ratio of the IR detector outputs is
proportional to the total atmospheric water vapor above the observer. Mims [in press,
2002b] has measured water vapor with an LED-based instrument for 12 years, including 10
years of calibrations at Mauna Loa Observatory, and we have already built prototypes of
this instrument suitable for use by GLOBE students. For a summary of the measurement,
which we will start supporting as a GLOBE Special Measurement in early 2003, see
http://www.mcs.drexel.edu/~dbrooks/globe/special_measurements/water_vapor.htm.
The data-collecting protocol for this measurement is similar to that for aerosol measurements. Students still record pairs of voltages, which will then be processed by GLOBEs computers. However, new science background materials will be required. An automated data collection option will be available. The calibration technique for water vapor is more involved than what is required for aerosol optical thickness. Initially, we will obtain transfer calibrations from a commercial instrument, Solar Light Companys MICROTOPS II, which is programmed to calculate water vapor from two near-IR channels. When opportunities arise, these transfer calibrations will be supplemented by comparisons with research-grade instruments at Mauna Loa Observatory and the CART site, and balloon- and space-based measurements.
During the process of writing our recent proposal, we thought a lot about how we could improve the implementation of GLOBE protocols. Despite the progress of the GLOBE program over the years, it is necessary to acknowledge this basic fact: The number of schools participating fully in one or more GLOBE protocols has been, and continues to be, small. In order to assess the prospects for conducting meaningful aerosol research within GLOBE, it is instructive to examine the reporting history for the original atmosphere protocols such as air temperature and cloud cover. Table 1 gives some data for GLOBE franchise/partner trained teachers. A reporting teacher has reported some GLOBE measurements at some time since her/his training.
| Time period | Teachers trained | Schools | Schools reporting | Teacher/School ratio | 1995-1998 | 2749 | 1592 | NA | 1.73 |
|---|---|---|---|---|
| 1999 | 1985 | 1203 | 379 (31.5%) | 1.65 |
| 2000 | 2448 | 1396 | 470 (33.7%) | 1.75 |
| 2001(thru August) | 1137 | 655 | 110 (16.8%) | 1.74 |
| Total thru present | 8319 | 4846 | 1566 (32.3%) | 1.72 |
Although the number of trained teachers has grown dramatically, the percentage of reporting teachers has held constant at about 1 in 3. Note also that, despite the growing understanding that it is better for teachers to work in teams at their school in order to conduct a successful GLOBE program, the teacher/school ratio has held constant at less than two teachers per school.
We have also looked at the number of schools reporting atmosphere data consistently over long periods of time, because such schools will most likely provide the most useful data. Table 2 shows some data for schools reporting air temperature and cloud type and cover. For air temperature, a single report consists of three measurements (maximum, minimum, current). For clouds, each report consists of two measurements (cover and type). We looked for schools that had at least 600 temperature reports or 400 cloud reports, representing 200 reporting days per year (September through August of the following year). As a typical U.S. school year is about 180-190 days, we interpreted this level of reporting to mean that a school reported every day and made some effort to report on weekends, too, as required by the protocols.
| 2000-2001 | 1999-2001 | |||
| Air Temperature | ||||
| Reports | 600 | 1000 | 1200 | 2000 | U.S. | 54 | 22 | 49 | 21 | Global | 214 | 78 | 204 | 63 |
| Cloud Cover and Type | Reports | 400 | 667 | 800 | 1333 | U.S. | 71 | 21 | 58 | 13 | Global | 243 | 83 | 215 | 63 |
Consider, for example, the number of schools reporting 600 air temperature. Globally, only 214 schools reported at least 600 air temperature values during the 2000-2001 school year. That global total includes only 54 US schools. Those values fell to 78 global and 22 US schools making 1000 air temperature reports, representing about 333 reporting days. The number of schools reporting at the same rate over two consecutive years (1999-2001) is less, but not dramatically so.
Cloud observations are significant because they require no equipment and, therefore, require only a minimum implementation plan by a school that allows it to fulfill reporting requirements, absent any other impediments that obtaining and caring for equipment might entail. During the 2000-2001 school year, 243 schools, including 71 US schools, submitted cloud reports on at least 200 days. These values fell to 83 global and 21 US schools reporting on at least 333 days. Again, the number of schools reporting for two consecutive years (1999-2001) is somewhat less. Not surprisingly, there is a large overlap in schools reporting both air temperature and cloud observations on a regular basis.
The inescapable conclusion from these data is that very few GLOBE schools have integrated reporting of the atmosphere protocols into their routine activities. The original atmosphere protocols are technically straightforward and, historically, the most widely reported. (The persistence of reporting for other protocols is harder to track because they do not necessarily have daily reporting requirements.) To date, only a few schools have reported usable sun photometer data.
We have concluded that a basic reason for low implementation is the lack of a clearly articulated research role for teachers - one in which they can (or, perhaps, must) participate as full science and teaching partners. In response to this conclusion, we plan to:
1. Expand our outreach to teachers for the aerosol and related GLOBE protocols.
2. Develop partnerships with scientists that will make full participation by teachers and their students both feasible and attractive, and design highly focused workshops to deliver the science and education content to implement these partnerships.
3. Develop a range of new measurements and projects based on the aerosol and related protocols, including some that can be conducted on a short-term basis. (Satellite validation measurements fall into this category.)
A pilot workshop to be held at NASAs Goddard Space Flight Center in early July, 2002, after submission of this paper, is our first attempt to implement this highly focused approach. We will consider the workshop a success if we are able to convey the reality that teachers can be full partners in genuine research activities, and if we can motivate participants to transmit the excitement of science to their students. We will provide our preliminary evaluation of this workshop during the oral presentation at the GLOBE 7th Annual Meeting.
Based on excellent work this year in the Netherlands and Cape Verde, we are optimistic about the possibilities for doing real atmospheric science with real GLOBE student data. However, the fact remains that virtually none of the sun photometers we have produced are actually being used on a regular basis. For the great majority of instruments, not a single data report has been received. As we start our new GLOBE project, we are hopeful that a broader range of measurements will make this kind of activity more attractive to more teachers and students. The aerosol protocol is not complicated. However, as is true for any worthwhile activity, it requires commitment, attention to detail, and a vision of the value of the activity. We have worked hard to provide the tools and the science vision. We are certainly open to suggestions about how we can do a better job. In return, we need for GLOBE partners, teachers, and students to become more actively involved with us.
We gratefully acknowledge data contributions to this paper from Ana Christina Ferro Marques, GLOBE Country Coordinator for Cape Verde; Drs. Arjan van der Meij, GLOBE teacher, and students from Christelijk College De Populier, The Hague, Netherlands. In the Netherlands, the Aerosol Monitoring Project has been supported by Folkert Boersma, from the Royal Netherlands Meteorological Institute (KNMI), and Yvette Bellens, Assistant GLOBE Country Coordinator for the Netherlands. Our work with schools in the Netherlands has been supported in part through a grant from NASA Goddard Space Flight Centers EOS/Aura Education and Public Outreach program.
Mims. F. M. III, A 5-Year Study of a New Kind of PAR Sensor. Submitted to Photochemistry and Photobiology. 2002a, currently under review.
Mims, F. M. III, An inexpensive and stable LED Sun photometer for measuring the water vapor column over South Texas from 1990 to 2001. 2002b Geophys. Res. Letters, in press.