Hurricane Earl and Saharan Dust, September 2010
David Brooks, with collaboration from Forrest Mims
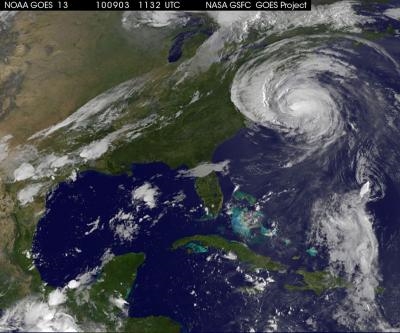
(Credit: NOAA/NASA GOES Project)
Hurricane Earl and Saharan Dust, September 2010David Brooks, with collaboration from Forrest Mims |
|
| GOES013 satellite image, 7:32 EDT, September 3, 2010. (Credit: NOAA/NASA GOES Project) |
|
Where I live (40°N, -75°W), Hurricane Earl passed almost entirely unnoticed on its way north along the Atlantic coast in
the early days of September.
It didn't even bring any rain to relieve our very dry late summer.
There was rough surf along the New Jersey and Delaware coasts, but not even anything that would qualify as "wind" at our house.
But, Earl did have one interesting feature -- it carried dust from the Sahara desert blown across the Atlantic and picked up in the Caribbean. The general scientific consensus is that when dust mixes with hurricanes, it diminishes their strength. This may (or may not!) explain why Earl caused relatively little damage. In any case, the passage of Earl and its dust is evident in the table of aerosol optical depth (AOT) values from late August and early September. August 31 is a typical hazy late summer sky, with relatively high AOT values. The situation is much different on September 4 and 5, as Earl is making its way up the coast. Now the AOT values are relatively small (<0.1) for this time of year. Physically, the AOT value at one wavelength cannot be smaller than the AOT at a longer wavelength, so the AOT at 505 nm is always larger than the AOT at 625 nm. The AOT values are used to calculate the so-called Ångstrom exponent (see here). A typical range for theÅngstrom exponent is 0.5-2.5, with natural atmospheres giving values around 1.3. Ångstrom exponents much smaller than 1 (when the AOT for the longer wavelength is closer to the AOT for the shorter wavelength) are associated with larger-diameter aerosols, like dust. Thus, we conclude that the sky around the edges of Earl probably carried significant amounts of dust even though the AOT values were still small -- less than 0.10. |
|
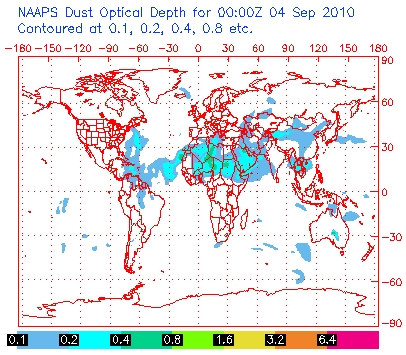
| The evidence provided by AOT measurements is consistent with information from other sources. This frame from the forecast loop for early September from the Navy Aerosol Analysis and Prediction System (NAAPS) shows dust in the Caribbean being carried to the north along Earl's track. These forecasts are based on a combination of surface and satellite observations and meteorological models. |
|
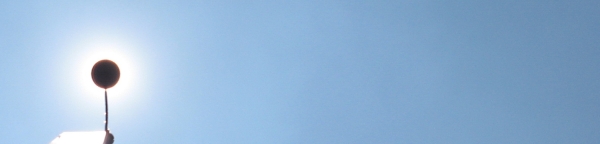
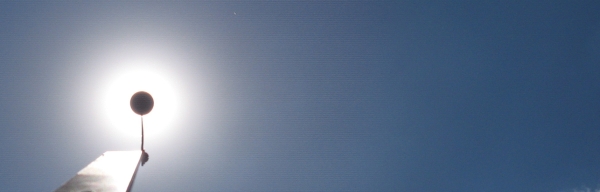
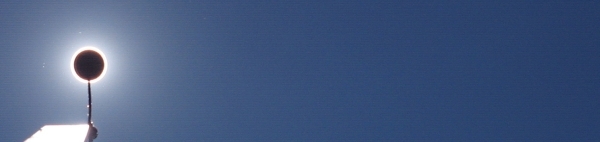
| There is more direct evidence of dust in the sky. Photographs of the solar aureole are shown here for August 31, September 4, and September 5. (All photos are taken with the same camera and the same manual settings: Canon PowerShot A530, ISO80, f5.6, 1/1600s.) The mid-blue sky on August 31 is typical for a hazy summer day. The much darker blue skies in the photos from September are typical of clear skies except for the huge solar aureole on September 4! By September 5, the dust is gone and the aureole is much smaller, more typical of the small AOT values (<0.10). |
|
| Is it possible that the large aureole is caused by something else, like water vapor? Unlikely, according to these data for total precipitable water vapor (PW) from the four NOAA GSP-MET sites nearest to where I live. The graph shows a brief upward "bump" in PW on September 3, but a dramatic drop on September 4. The Millersville site (red symbols) is about 100 km west of my location, so it saw a smaller increase in PW with the passage of Earl. (None of the PW values prior to Earl are particularly large for this time of year -- it has been very dry!) At the times the aureole photos were taken on September 4 and 5, the PW was around 1.5 cm H2O. | 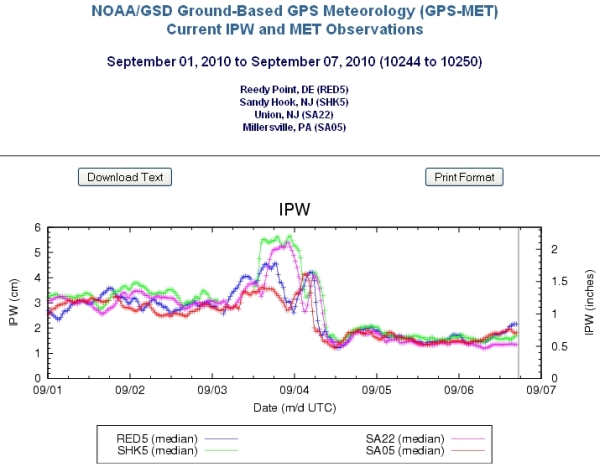 |
The last time there was major atmospheric dust this far north on the east coast was in March, 2010. That dust cloud, from Asia, was also tracked on the NAAPS website. It is interesting to compare the information and photos on this web page with my web page from March.