The DHT22 is a capacitive sensor that uses properties of a dielectric material to measure total moisture in the air and a temperature sensor to convert that value into a relative humidity value. The Adafruit data logger shield fits on an UNO board. It includes a real time clock set from your computer clock and an SD card for saving data.
This project doesn't require any specific Arduino programming skills, but it does assume that you have downloaded and installed the free Arduino Integrated Development Environment (IDE) on your computer, and that you know how to use the IDE to upload programs ("sketches") to your UNO. There are many online tutorials that explain how to do this.
Assembly Instructions
- Tools
This project requires some soldering. Use .04" diameter or smaller tin/lead or lead-free resin core solder and a soldering iron with a fine pencil tip, 50W or less. If you've never soldered anything before, get some help from someone who has and practice soldering wires together before starting on this project. You will also need small needlenose and diagonal cutting pliers, a Phillips screwdriver, a craft knife, and a hot glue gun (as used for craft projects) or silicone or latex caulk. You can find a helpful introduction to soldering HERE.
- Prepare UNO and data logging boards
• Clip off the 2.1 mm power input jack leads close to the back of the UNO.
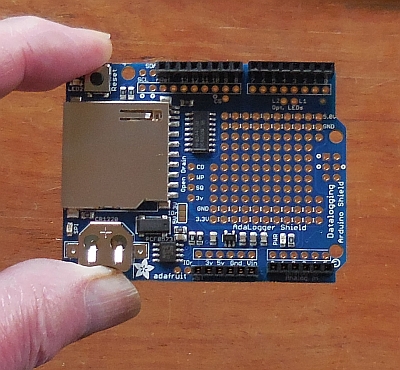
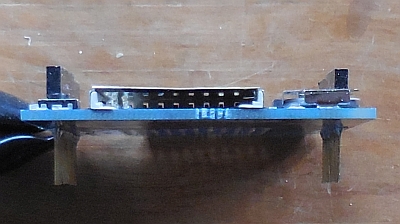
• Don't use the header strip that comes with the datalogging shield. Use the 6-pin and 8-pin stacking headers. Place them on the shield as shown. Be sure to use the outer row of pins. Note the location of the headers – not all the holes in the outer row are used. For this project you don't need to install the 3x3 header (on the righthand edge of the shield).
• Start by soldering just one pin on each stacking header. Then check to see that the header pins are firmly against the surface of the board and that they are exactly perpendicular to the board. If necessary, reheat the soldered pin and adjust the row of pins. Then solder the rest of the pins.
If you are not used to soldering, it is not difficult to create problems when soldering these headers into place. Because these pins are close together, make sure your soldering iron has a small pencil tip. Press the tip against both the solder pad and the pin. Then touch the pin near the soldering iron tip to melt some solder onto the connection.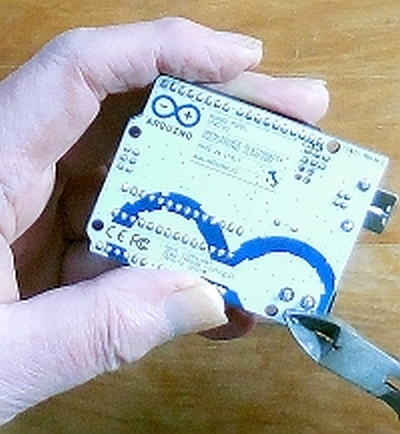
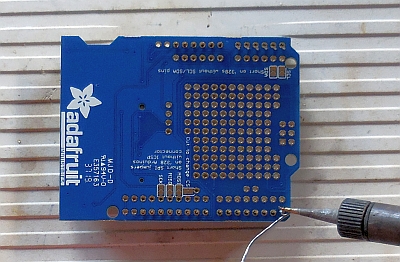
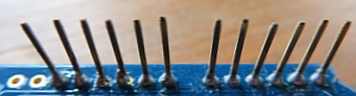
The soldered header pins should have no large "blobs" of solder anywhere around them, and no solder bridges between any of the pins. Blobs of solder usually mean that a pin and solder pad has not been properly heated. Such "cold" joints may work at first, but sooner or later (probably sooner!) they will fail. Properly soldered pins should look like this:
- Attach power, ground, 10 kΩ resistor, and output connections to the DHT22.
• Viewed from the "top" (the side with the vents in it), the third DHT22 pin from the left as shown in the image isn't needed. You can bend it out of the way (toward the back of the sensor) or clip it off. Cut 4" (10 cm) red, black, and blue wires. Strip a little less than 1/4" from one end and a little more than 1/4" from the other end. Use needlenose pliers to bend a small hook in each of the three required pins. In the shorter stripped end of each wire, bend a small hook.
• Bend a small hook in one end of the 10 kΩ resistor. "Catch" the bent end of the red wire and the resistor over the hook in the leftmost pin and use needlenose pliers to crimp the hooks over each other. Solder the wire and resistor to this DHT22 pin.
• "Catch" the bent end of the blue wire over the second DHT22 pin from the left. Crimp the hooks and solder the wire. Slide a 0.5" (1.5 cm) piece of heat shrinkable tubing over this connection and gently heat the tubing with the edge of your soldering iron, just enough so that the tubing won't slide back over the blue wire.
• About 1" (2.5 cm) from the blue wire soldered joint, use a craft knife to trim away about 1/4" (0.5 cm) of insulation. Be careful not to cut into the wire itself. Wrap the other end of the resistor around this bared wire and solder it in place. Optionally (as shown in the image), you can slide another short piece of heat shrinkable tubing over this soldered connection and heat it gently.
• As with the other pins, solder the black wire onto the rightmost pin.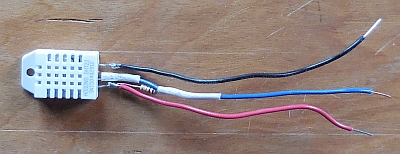
- Prepare PMS5003 and breadboard
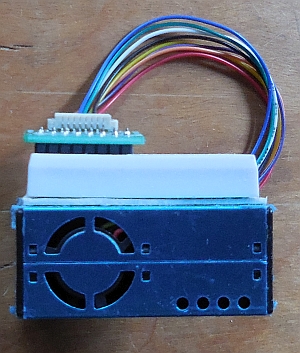
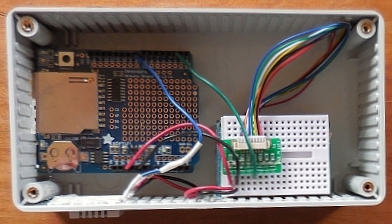
• Remove the paper from the sticky backing on the mini breadboard. Mount the breadboard a little less than 3/16" (0.4 cm) from the edge of the Plantower casing where the fan inlet and output ports are located, with the circular opening on the left, as shown in the image.
• Insert one end of the Plantower cable into the Plantower connector, with the colors oriented as shown (the red cable wire on the left, as viewed from the top). Insert the other end into the small pc board connector, with the colors oriented as shown (the black cable wire on the left, as viewed from the top). Make sure the cable are pushed firmly onto their connectors. You can push on them with a flat screwdriver blade, but be careful not to damage the wires. There is only one orientation that will allow seating the cable ends properly.
• Attach the pc board on the mini breadboard, as shown.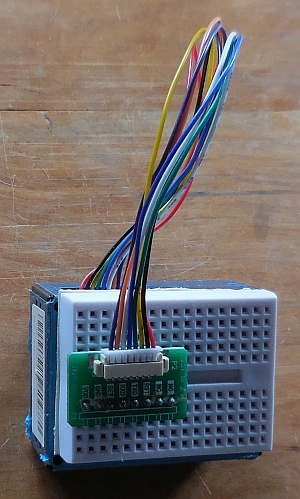
- Preliminary testing of PMS5003
• Attach a 4" (10 cm) red wire (strip a little more than 1/4" (0.5 cm) from both ends of these wires) from the PMS5003 cable pc board VCC pin to the 5 V power pin on your UNO. Attach a 4" black wire from the pc board GND pin to an UNO GND pin. Attach 4" of some other color wire from the pc board TXD pin to your UNO digital pin 2 – remember that the pins are numbered from 0, not from 1.
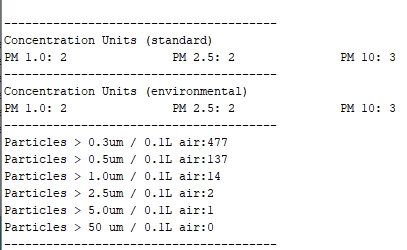
• Open your Arduino IDE, load the PMS5003_Arduino.ino sketch (see "Software" section below), attach a USB cable, and upload this sketch to your UNO. Open the serial port window. When the sketch runs, you should see something like what is shown in the image, updated every 2 seconds. If you don't see this output, the most likely reason is that your cable is not securely or properly connected.
• If you are doing this test indoors in a typical home or office space, the PM values will probably be less than 10. You can see higher values by lighting a match, extinguishing it, and putting the smoking end briefly near the plantower fan opening.
• Note that the output from this sketch includes both "standard" and "environmental" calculations. Sometimes these values are the same, but especially for higher particle concentrations, they may be different. The indoor or outdoor monitoring, the environmental calculations are the appropriate ones to use.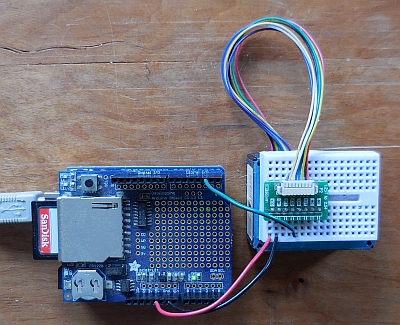
- Attach UNO and data logging boards to case
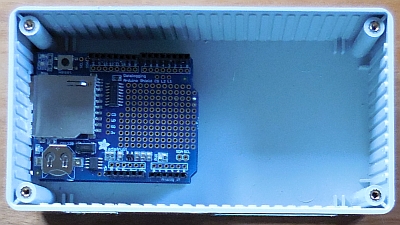
• Insert the data logging shield header pins into on the UNO headers – they will fit only one way. Make sure all the pins mate with their UNO header positions – it is possible that one or more long pins will be bent to they will not be inserted into the header. Fit the CR1220 coin cell into its holder on the data logging shield, "+" (smooth) side facing up. (You won't be able to insert the battery after the board assembly is mounted in the case.)
- Final assembly
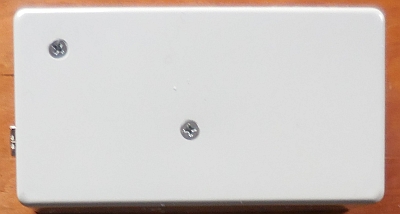
• Attach the UNO/data logging shield aassembly to the bottom of the case using two sheet metal screws. Tighten the screws gently. If they are over-tightened they will strip out the holes so they will no longer hold the board firmly or even break in the board. NOTE: The data logging shield shown in the image is an older version, but for this project it works the same as the shield provided with this kit.
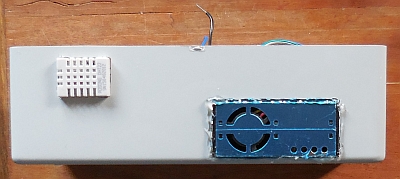
• Gently bend back the DHT22 pins away from the vented side. Push the DHT22 into the rectangular cutout, with the vented side toward the outside of the case. Secure it in place with a hot glue gun or some caulk on the inside of the case. Be careful not to get any glue or caulk in the vents of the DHT22 case.
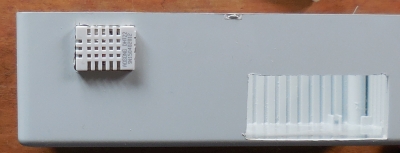
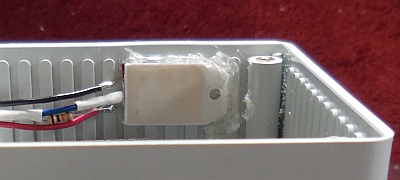
Insert the Plantower into its cutout. The face of the Plantower case should estend a little past the outside of the system case. Secure the Plantower in place with a hot glue gun or some caulk around the outside of the case. Be careful not to get any glue or caulk on or in the fan inlet and outlet ports.
• Use the wires you cut when you tested the Plantower. Cut and strip red, black, and some other color wires. Connect the red wire from the Plantower pc board VCC pin connection on the mini breadboard to your UNO 5 V power pin. Connect the black wire between the pc board/breadboard GND connection to a GND pin on your UNO. Connect the third wire between the pc board/breadboard TXD pin to digital pin 2 on your Arduino.
• Connect the red wire from the DHT22 to the pc board/breadboard VCC connection. Connect the black DHT22 wire to the pc board/breadboard GND connection. Connect the third DHT22 wire to digital pin 8 on your UNO. You're done!
• To start running this system, first upload and run the RTC_2.ino sketch (see "Software section, below)." This sketch sets the data logger's real time clock according to the time maintained in your computer. The clock will keep time even when power is disconnected (for a few years!) and you shouldn't have to run this sketch again.
• Insert an SD card in its holder (the "cut" corner goes into the holder, printed side up), upload the plantower_DHT22_log_2.ino sketch (see "Software" section below), and let the system run for a few minutes. When you run this system through a USB cable attached to your computer, some sensor output – the day of the month and the time, with some PM values – is displayed in the IDE's serial port window.
• When everything's working, disconnect the USB cable and plug in the 9 VDC power supply. Record data for an hour or so, turn the system off, and open the .CSV file stored on the SD card in a spreadsheet. You should see output data reported every two or three minutes.
• There's room on the mini breadboard for connections to one or two additional sensors or display devices if you wish to add them later. Depending on what you're adding, you might need to make additional cutouts in the case.
• You could consider attaching four small rubber stick-on bumpers in each corner of the bottom of the case to keep the case from sliding on a slick surface. You might even try putting a round bead of hot glue or caulk in each corner, which would at least temporarily have the same effect. (Neither hot glue nor caulk stick particularly securely to the ABS plastic case.)
Software
• You can download the Arduino Integrated Development Environment for Mac, PC, or Linux computers, and find installation instructions HERE. For the DHT22 sensor, you need to download a software library HERE. You can find instuctions for adding libraries HERE. The Plantower PMS5003 particulate sampling sensor doesn't need a software library (it uses the UNO's built-in "software serial" capabilities), but it does need code for interpreting the sensor data that is automatically sent over the serial connection about once per second.
Three Arduino sketches are required to get this system up and running:
- RTC2.ino, a sketch that sets the time on the real time clock on the data logging shield the first time the shield is used.
- PMS5003_Arduino.ino, a sketch that tests the operation of the Plantower PMS5003 sensor.
- plantower_DHT22_log_2.ino, a sketch that collects and stores PMS5003 and DHT22 data.
/* RTC_2.ino, D. Brooks, August 2018
  This code has been modified to select old
  or new datalogging shields. The clock chip on the
  shields is different.
*/
#include <Wire.h>
#include <RTClib.h>
//RTC_DS1307 RTC; // old data logger shield
RTC_PCF8523 RTC;  // new data logger shield
void setup() {
  Serial.begin(9600);
  Wire.begin();
  RTC.begin();
  if (RTC.begin()) Serial.println("clock running...");
  else Serial.println("clock not running...");
  RTC.adjust(DateTime(__DATE__, __TIME__));
  DateTime now=RTC.now();
  Serial.println(now.year());
  Serial.println("trying...");
  Serial.println("Getting time...");
  Serial.print(now.year());   Serial.print('/');
  Serial.print(now.month());  Serial.print('/');
  Serial.print(now.day());    Serial.print(' ');
  Serial.print(now.hour());   Serial.print(':');
  Serial.print(now.minute()); Serial.print(':');
  Serial.println(now.second());
}
void loop() {
}

// PMS5003_Arduino.ino (from Adafruit)
// For UNO and others without hardware serial, we must use software serial...
// pin #2 is IN from sensor (TX pin on sensor), leave pin #3 disconnected
// comment these two lines if using hardware serial
#include <SoftwareSerial.h>
SoftwareSerial pmsSerial(2, 3);
void setup() {
  // our debugging output
  Serial.begin(9600);
  // sensor baud rate is 9600
  pmsSerial.begin(9600);
}
struct pms5003data {
  uint16_t framelen;
  uint16_t pm10_standard, pm25_standard, pm100_standard;
  uint16_t pm10_env, pm25_env, pm100_env;
  uint16_t particles_03um, particles_05um, particles_10um, particles_25um, particles_50um, particles_100um;
  uint16_t unused;
  uint16_t checksum;
};
struct pms5003data data;
void loop() {
  if (readPMSdata(&pmsSerial)) {
    // reading data was successful!
    Serial.println();
    Serial.println("---------------------------------------");
    Serial.println("Concentration Units (standard)");
    Serial.print("PM 1.0: "); Serial.print(data.pm10_standard);
    Serial.print("\t\tPM 2.5: "); Serial.print(data.pm25_standard);
    Serial.print("\t\tPM 10: "); Serial.println(data.pm100_standard);
    Serial.println("---------------------------------------");
    Serial.println("Concentration Units (environmental)");
    Serial.print("PM 1.0: "); Serial.print(data.pm10_env);
    Serial.print("\t\tPM 2.5: "); Serial.print(data.pm25_env);
    Serial.print("\t\tPM 10: "); Serial.println(data.pm100_env);
    Serial.println("---------------------------------------");
    Serial.print("Particles > 0.3um / 0.1L air:"); Serial.println(data.particles_03um);
    Serial.print("Particles > 0.5um / 0.1L air:"); Serial.println(data.particles_05um);
    Serial.print("Particles > 1.0um / 0.1L air:"); Serial.println(data.particles_10um);
    Serial.print("Particles > 2.5um / 0.1L air:"); Serial.println(data.particles_25um);
    Serial.print("Particles > 5.0um / 0.1L air:"); Serial.println(data.particles_50um);
    Serial.print("Particles > 10.0 um / 0.1L air:"); Serial.println(data.particles_100um);
    Serial.println("---------------------------------------");
  }
}
boolean readPMSdata(Stream *s) {
  if (! s->available()) {
    return false;
  }
  // Read a byte at a time until we get to the special '0x42' start-byte
  if (s->peek() != 0x42) {
    s->read();
    return false;
  }
  // Now read all 32 bytes
  if (s->available() < 32) {
    return false;
  }
  uint8_t buffer[32];
  uint16_t sum = 0;
  s->readBytes(buffer, 32);

  // get checksum ready
  for (uint8_t i=0; i<30; i++) {
    sum += buffer[i];
  }
  /* debugging
  for (uint8_t i=2; i<32; i++) {
    Serial.print("0x"); Serial.print(buffer[i], HEX); Serial.print(", ");
  }
  Serial.println();
  */
  // The data comes in endian'd, this solves it so it works on all platforms
  uint16_t buffer_u16[15];
  for (uint8_t i=0; i<15; i++) {
    buffer_u16[i] = buffer[2 + i*2 + 1];
    buffer_u16[i] += (buffer[2 + i*2] << 8);
  }
  // put it into a nice struct :)
  memcpy((void *)&data, (void *)buffer_u16, 30);
  if (sum != data.checksum) {
    Serial.println("Checksum failure");
    return false;
  }
  // success!
  return true;
}

/* plantower_DHT22_log_2, D. Brooks, September 2018
  Logs data from a Plantower PMS5003 sensor and a DHT22 T/RH sensor.
  A data stream is received about once per second and KNT_MAX values
  are averaged (200 samples = about 3 minutes). See also example code from Adafruit.
  Includes particle counts and conversion to PM2.5 AQI values.
*/
#define ECHO_TO_SERIAL 1
#define KNT_MAX 200
#include <SoftwareSerial.h>
SoftwareSerial pmsSerial(2, 3);
#include <DHT.h>
#define DHTPIN 8
#define DHTTYPE DHT22
DHT dht(DHTPIN,DHTTYPE);
#include <SD.h>
#define SDpin 10
#include <SPI.h>
#include <RTClib.h>
RTC_DS1307 rtc; // clock in old data loggers
//RTC_PCF8523 rtc; // clock in new data loggers
int knt=0,yr,mon,dy,hr,mn,sec;
float pm1=0,pm25=0,pm10=0,AQI25,AQI10;
float p03=0,p05=0,p10=0,p25=0,p50=0,p100=0;
File logfile;
void setup() {
  rtc.begin(); Serial.begin(9600);
  pmsSerial.begin(9600);
  Serial.print(F("Initializing SD card..."));
  pinMode(SDpin,OUTPUT);
  if (!SD.begin(SDpin)) {Serial.println("Card failed.");
  delay(50);exit(0);}
  Serial.println("card initialized.");
  logfile=SD.open("PM25_DHT.CSV",FILE_WRITE);
  logfile.print("yr,mon,day,hr,min,sec,day_frac,DHT_T,DHT_RH,");
  logfile.println("PM1,PM2.5,PM10,AQI2.5,AQI10,p0.3,p0.5,p1.0,p2.5,p5,p10");
  logfile.flush();
  #if ECHO_TO_SERIAL
  Serial.println("day hr:min:sec PM1 PM2.5 PM10");
  #endif // ECHO_TO_SERIAL
}
struct pms5003data {
uint16_t framelen;
uint16_t pm10_standard, pm25_standard, pm100_standard;
uint16_t pm10_env, pm25_env, pm100_env;
uint16_t particles_03um,particles_05um,particles_10um;
uint16_t particles_25um,particles_50um,particles_100um;
uint16_t unused; uint16_t checksum;
};
struct pms5003data data;
void loop() {
  if (readPMSdata(&pmsSerial)) { // reading data was successful!
    pm1+=data.pm10_env; pm25+=data.pm25_env; pm10+=data.pm100_env;
    p03+=data.particles_03um; p05+=data.particles_05um;
    p10+=data.particles_10um; p25+=data.particles_25um;
    p50+=data.particles_50um; p100+=data.particles_100um;
    knt++;
    if (knt==KNT_MAX) {
      DateTime now=rtc.now();
      yr=now.year(); mon=now.month(); dy=now.day();
      hr=now.hour(); mn=now.minute(); sec=now.second();
      pm1/=knt; pm25/=knt; pm10/=knt; p03/=knt; p05/=knt; p10/=knt;
      p25/=knt; p50/=knt; p100/=knt;
      if (pm25<=12.0) {  // Convert to AQI value.
        AQI25=(50.-0.)/(12.0-0.)*(pm25-0.0)+0.;
      }
      else if (pm25<=35.4) {
        AQI25=(100.-50.)/(35.4-12.0)*(pm25-12.0)+50.;
      }
      else if (pm25<=55.4) {
        AQI25=(150.-100.)/(55.4-35.4)*(pm25-35.4)+100.;
      }
      else if (pm25<=150.4) {
        AQI25=(200.-150.)/(150.4-55.4)*(pm25-55.4)+150.;
      }
      else if (pm25<=250.4) {
        AQI25=(300.-200.)/(250.4-150.4)*(pm25-150.4)+200.;
      }
      else if (pm25<=350.4) {
        AQI25=(400.-300.)/(350.4-250.4)*(pm25-250.4)+300.;
      }
      else if  (pm25<=500.4) {
        AQI25=(500.-400.)/(500.4-350.4)*(pm25-350.4) +400.;
      }
      else AQI25=501.;
      if (pm10<=54.) {
        AQI10=(50.-0.)/(54.-0.)*(pm10-0.)+0.;
      }
      else if (pm10<=154.) {
        AQI10=(100.-50.)/(154.-54.)*(pm10-54.)+50.;
      }
      else if (pm10<=254.) {
        AQI10=(150.-100.)/(254.-154.)*(pm10-154.)+100.;
      }
      else if (pm10<=354.) {
        AQI10=(200.-150.)/(354.-254.)*(pm10-254.)+150.;
      }
      else if (pm10<=424.) {
        AQI10=(300.-200.)/(424.-354.)*(pm10-354.)+200.;
      }
      else if (pm10<=504) {
        AQI10=(400-300)/(504.-424.)*(pm10-424.);
      }
      else if (pm10<=604.) {
        AQI10=(500.-400.)/(604.-504.)*(pm10-504.)*400.;
      }
      else AQI10=501.;
      logfile.print(yr);     logfile.print(','); logfile.print(mon);    logfile.print(',');
      logfile.print(dy);     logfile.print(','); logfile.print(hr);     logfile.print(',');
      logfile.print(mn); logfile.print(','); logfile.print(sec);    logfile.print(',');
      logfile.print(dy+hr/24.+mn/1440.+sec/86400.,5); logfile.print(',');
      logfile.print(dht.readTemperature(),1); logfile.print(',');
      logfile.print(dht.readHumidity(),0);    logfile.print(',');
      logfile.print(pm1,1);   logfile.print(','); logfile.print(pm25,1);  logfile.print(',');
      logfile.print(pm10,1);  logfile.print(','); logfile.print(AQI25,0); logfile.print(',');
      logfile.print(AQI10,0); logfile.print(','); logfile.print(p03); logfile.print(',');
      logfile.print(p05); logfile.print(','); logfile.print(p10); logfile.print(',');
      logfile.print(p25); logfile.print(','); logfile.print(p50); logfile.print(',');
      logfile.println(p100); logfile.flush();
      #if ECHO_TO_SERIAL
        Serial.print(dy);Serial.print(' ');Serial.print(hr);Serial.print(':');
        Serial.print(mn);Serial.print(':');Serial.print(sec);Serial.print(' ');
        Serial.print(pm1,1);Serial.print(", ");Serial.print(pm25,1);
        Serial.print(", ");Serial.print(pm10,1);Serial.println();
      #endif // ECHO_TO_SERIAL
      pm1=0; pm25=0; pm10=0; // reset PM totals
      p03=0; p05=0; p10=0; p25=0; p50=0; p100=0; knt=0;
    }
  }
}
boolean readPMSdata(Stream *s) {
if (! s->available()) { return false; }
// Read a byte at a time until we get to the special '0x42' start-byte
if (s->peek() != 0x42) { s->read(); return false; }
// Now read all 32 bytes
if (s->available() < 32) { return false; }
uint8_t buffer[32]; uint16_t sum = 0; s->readBytes(buffer, 32);
// get checksum ready
for (uint8_t i=0; i<30; i++) { sum += buffer[i]; }
// The data comes in endian'd, this solves it so it works on all platforms
uint16_t buffer_u16[15];
for (uint8_t i=0; i<15; i++) {
buffer_u16[i] = buffer[2 + i*2 + 1]; buffer_u16[i] += (buffer[2 + i*2] << 8); }
// put it into a nice struct :)
memcpy((void *)&data, (void *)buffer_u16, 30);
if (sum != data.checksum) { Serial.println("Checksum failure"); return false; }
return true; // success!
}
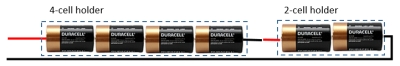
Using Your Particulate Sensor
This particulate sampling system is suitable for indoor or outdoor use wherever there is access to an AC power outlet. In principle, you can power this sytem with batteries, but the constantly running fan on the PMS5003 is a bigger power draw than the typical Arduino project. One way to use batteries is to connect 6 D cells in series, using commonly available 2- and 4-cell holders. You will need to buy or salvage a 2.1 mm plug to attach to the battery output. 6 new alkaline "1.5 V" D cells connected in series should provide an output of about 10 V. The system will stop running when the input to the UNO falls below 7.5 V, so monitor the battery output often.