Measuring Total Column Water Vapor with an IR Thermometer
NOTE: In general, this project is possible only if you are close to a
NOAA GPS-MET or
NASA AERONET site.
What does "close" mean? There is no definitive answer to this question. If you are within a few 10's of kilometers of one or
more sites, and especially
if those sites are north or south of your location (because weather patterns generally move west-to-east), at roughly the
same elevation, then you are probably "close" enough.
This is NOT a short-term project if you are examining how to calibrate IR thermometers against an independent source of water vapor data.
It will probably take several months to collect enough data to do calibrations properly.
If you are not near a GPS-MET or AERONET site, you may still be able to collect and analyze water vapor data if you have access to an IR thermometer
that has been calibrated elsewhere.
Background
Water vapor is Earth's most important greenhouse gas. Without the ability of the H2O molecule to
warm the atmosphere by absorbing and re-emitting radiation,
our planet would be a very cold and inhospitable home! Other gases, such as carbon dioxide and methane, are more efficient
greenhouse gases than water vapor. The concentrations of these gases, and their subsequent effect on global temperatures,
are being increased by human activities but their overall impact is still small compared to the relatively constant contribution of water vapor.
When scientists monitor the amount of water vapor in Earth's atmosphere, they waht to measure the "total column water vapor," also called
the "precipitable water vapor" or PW, in the atmosphere.
Imagine holding a glass with straight sides in your hand, pointed straight up at the sky. The diameter of the glass defines a column of
atmosphere above the glass. Now imagine that all the water vapor in that column of air could magically be condensed and collected in the glass.
The height of the water in the glass is the PW, measured in centimeters of water. Typical PW values are a few centimeters of water.
As you might imagine, this is not an easy measurement to make accurately from the ground! For many years, scientists have used weather
balloons that rise to heights near the top of the atmosphere to measure the vertical distribution of water vapor — values which
can then be summed (integrated) to give PW. An approximate measure of PW can be calculated from the air temperature and relative humidity
at the ground. This value can also be obtained from measurements of direct sunlight at specific wavelengths and by analyzing the time delay
in receiving signals from global positioning (GPS) satellies.
It turns out that, perhaps surprisingly, measuring infrared radiation from the cloud-free zenith sky
(the zenith sky is the sky directly above you) is another way to
infer PW values. This method is described in this paper:
Forrest M. Mims, III, Lin Hartung Chambers, David R. Brooks, 2011
Measuring Total Column Water Vapor by Pointing an Infrared Thermometer at the Sky
Bull. Amer. Meteor. Soc., 92, 1311-1320.
None of these methods of measuring PW are perfect, and the values obtained by various methods are usually slightly different under the same
sky conditions. But, the IR thermometer method has one HUGE advantage — it is very cheap and can be done anytime, day or night,
when the zenith sky is free of clouds.
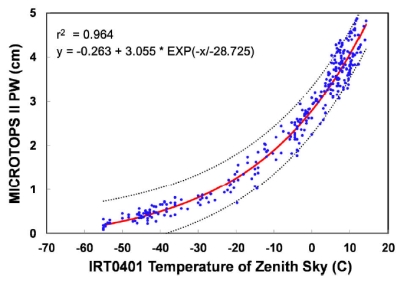
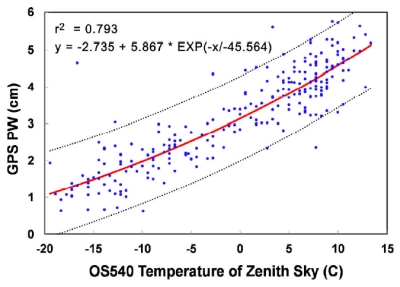
The graphs below show the relationship between some IR thermometer measurements and the MICROTOPS II sun photometer or GPS-MET values.
 |  |
It is important to understand that handheld IR thermometers are made for measuring the temperature of a relatively nearby
surface like a wall, an industrial motor, or skin. The calibration of the instrument is based on assumptions about that surface,
and specifically about its emissivity. Such an
instrument might give a reliable measurement of the temperature at the base of a uniform low stratus cloud layer, but other than that,
the interpretation
of the "temperature" displayed when one of these instruments is pointed up at the sky is somewhat ambiguous.
It is more accurate to say simply that an IR thermometer pointed at the sky displays
a value that is related to the infrared radiation from the sky, as seen through that instrument's radiation detector, but the value
can no longer be called a temperature. However, that doesn't matter for this application. If displayed "temperature" values
can be calibrated against an independent source of PW values, then those values can be
interpreted as serving as a proxy for a measurement of PW.
The fact that different methods of determining PW give different values and that different IR thermometers use different detectors greatly
complicates these measurements!
A protocol for using these instruments to monitor PW requires that a particular brand and model of IR thermometer
be calibrated against a specific source
of PW data. MICROTOPS instruments cost several thousand dollars. The AERONET system, another source of sun-photometer based PW values, has a limited
number of sites, as does the GPS-MET system using signal from global positioning satellites. But, once a calibration source has been found,
an IR thermometer pointed at the clear sky should provide a portable and inexpensive way to measure PW.
Research Questions
One of the major advantages of GPS-MET and IR thermometer measurements of PW is that they can be made day or night, as opposed to sun
photometer methods which obviously must be made during the day. One question which hasn't been addressed by the paper referenced here is
the possibility that different calibrations might be needed for nighttime and daytime measurements.
Addressing this question requires data from a GPS-MET station. Another interesting question is whether there are
calibration or
performance differences when the IR
thermometer is pointed at other point in the sky other than the zenith, but still away from the sun during the day.
The purpose of looking at these
questions is to refine this method to get the best possible performance from a potentially very useful way to monitor the
water vapor in our planet's atmosphere.
Experiment Protocol
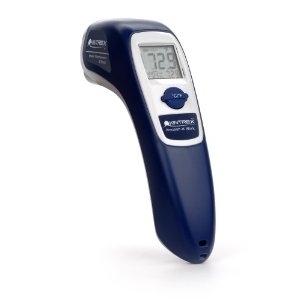 This protocol is based on the Kintrex IRT0421 non-contact IR thermometer. The IRT0421 has a distance-to-spot diameter ratio of 12:1,
or a field of view of about 5°.
There are many brands of similar instruments, some of which have much wider fields of view; for example, the Kintrex IR0401 has a field of view of
about 60°. The protocol
is the same regardless of the field of view but, as noted above,
the relationship between water vapor and the displayed temperature reading will be different for every
instrument. As a result, it is important to make all measurements in a research project with the same brand and model of instrument.
(The variation in readings among
several samples of the same brand and model should be very small.) In general, instruments with a smaller field of view are preferable because
the portion of sky they view is less likely to include contamination from the sun or clouds.
This protocol is based on the Kintrex IRT0421 non-contact IR thermometer. The IRT0421 has a distance-to-spot diameter ratio of 12:1,
or a field of view of about 5°.
There are many brands of similar instruments, some of which have much wider fields of view; for example, the Kintrex IR0401 has a field of view of
about 60°. The protocol
is the same regardless of the field of view but, as noted above,
the relationship between water vapor and the displayed temperature reading will be different for every
instrument. As a result, it is important to make all measurements in a research project with the same brand and model of instrument.
(The variation in readings among
several samples of the same brand and model should be very small.) In general, instruments with a smaller field of view are preferable because
the portion of sky they view is less likely to include contamination from the sun or clouds.
The IRT0421 thermometer will display values as low as -60°C. This is better than some other brands and models,
because the sky appears to be
very cold unless the thermometer is pointed at the sun. (As an initial experiment, you could point your thermometer at several points across the
sky on a clear day, including looking directly at the sun.)
Many IR thermometers, including the IRT0421, include a laser pointer for marking the center of the instrument's "target." This feature is of
no value for this experiment and the pointer should be turned off (as it can be on the IRT0421) or masked with tape.
NEVER point a laser near anyone's eyes!
Here are specific steps for collecting and analyzing sky temperature data:
Data Collection
- Prepare a data log in your experiment notebook. The log should include the date, time,
air temperature and relative humidity (online sources are OK), and sky conditions (estimated cloud type and amount, clear
or hazy sky). If more than one person is collecting data,
then there should be a place for entering your name. If you are examining the research question about comparing zenith and non-zenith
measurements, record the zenith angle. Finally, of course, there should be a place to record the displayed temperature.
- Select a day and time when there are no clouds in your thermometer's field of view. Mid-morning and/or mid-afternoon is best. Be consistent
and careful about recording
times! Local time is OK, but if you are using "clock time" be sure to indicate whether it is standard or daylight saving
time. Universal time (UT) is a better choice because the online data sources you will need to calibrate your instrument typically use UT.
On the east coast of the US, UT is local standard time plus 5 hours or local daylight saving time plus 4 hours.
You should
try to record data at nearly the same time(s) each day. Do NOT make this measurement when
there are clouds in the sky where you are pointing your instrument! Be especially careful not to make measurements when cirrus clouds are present.
Thin cirrus clouds can be hard to see. If you are in doubt, you can collect data
and add a comment about possible cirrus cloud contamination.
If you are going to use a GPS-MET site for calibration (see NOTE at the beginning of this article), it would be a good idea to make
measurements at 15 or 45 minutes after the hour, because GPS-MET data are collected over half-hour intervals and displayed with times
at 15 and 45 minutes after the hour.
If you are making measurements at night, include a comment about the moon's phase (if it is visible in the sky) and the visibility of stars.
It may be hard to distinguish clouds in the night sky, but if stars are obscured, then you should not collect data.
- Face away from the sun, with the thermometer held in your shadow to shield it from direct sunlight. (This doesn't matter at night, of course.)
Hold the instrument so its
aperture points either straight up at the zenith or at the non-zenith angle you have selected. Squeeze the "trigger" and record the displayed temperature value. Most of these instruments, including the
IRT0421, have a "display and hold" feature that retains the displayed reading for several seconds after releasing the trigger. Record the
value along with the time and other information. Get air temperature and relative humidity from a nearby online source. (You probably don't need
to do this immediately.)
- Analysis of these data will require measurements taken under a wide range of PW values.
It almost certainly will take at least several
months to accumulate sufficient data because PW is seasonally dependent with, on average, higher values in summer than in winter.
Calibration
After you have collected a series of measurements under a variety of conditions, you will need to calibrate your instrument
against an independent source of PW data.
- Transfer the data from your notebook to a computer spreadsheet program. (You should have been doing this while you were collecting data.)
Include all the items in the data record.
- Find the neareset NOAA GPS-MET or NASA AERONET site, using the links at the beginning of this article. Download the data and insert it
into your spreadsheet. The AERONET data are associated with a specific time. The GPS-MET data are half-hour averages recorded at 15 and
45 minutes after the hour. Associate the times
and values with the times of your measurements.
- Construct a graph of the temperature reading from your IR thermometer on the x-axis and the PW from your calibration source on the y-axis.
- You can now use your spreadsheet program's "trendline" feature (this is what it's called in Excel) to determine the "best fit" for the
data — the curve which best translates displayed temperature to PW. Bear in mind that the temperature values you have recorded from your
IR thermometer are not really "temperatures." They are, instead, a measure of your instrument's response to infrared radiation from the sky and,
hopefully, a proxy for PW.
Of course, there will NOT be a perfect agreement between temperature and PW. It is not even clear what kind of function to use to
determine the best fit.
Certainly, the relationship will not be linear. In general, it is best to assume some underlying physically-based functional relationship
between two variables.
Variables may have a trigonometric or exponential relationship, for example. In this case, however, there is no apparent basis for
assuming a physically based
relationship between the temperature reading and PW. So, you can select whatever kind of curve fit that appears to work. In the graphs above,
an exponential relationship was assumed, and this appears to have been a good choice based simply on looking at the data. But, a polynomial
relationship may have worked equally well, or even better. However, it is usually a bad idea to fit these kinds of data with higher-order
polynomials. If the data appear not to be well-represented by a polynomial of degree no higher than 3, that is probably not a good choice (because
you may be modeling the "noise" in the data as much as the underlying relationship).
- Considering the research questions posed above, you will need to separate the data by night/day and/or zenith/non-zenith. You may be able
to think of other questions to ask, too. To address any such questions you will beed enough data to determine the best fit curve.
There are no fixed rules for determining what is "enough" data,
but probably you should have
no less than 10 data points, spanning as wide a range of temperature values as possible, for any condition you wish to analyze.
Analysis
The purpose of this project is to examine in more detail the relationship between clear-sky "temperature" and PW. This relationship
depends on having an independent source of PW data. As noted above, it is not possible to measure total column water vapor directly
from the ground —
otherwise, there would be no point to this project or to developing other methods for inferring PW from ground-based measurements! However,
it is possible to approximate PW from the dew point temperature, which is calculated from air temperature and relative humidity. These
calculations were described in the 1960's:
C. H. Reitan. Surface dew point and water vapor aloft. Journal of Applied Meteorology, 2, 776-777, 1963.
W. L. Smith.
Note on the relationship between total precipitable water and surface dew point. Journal of
Applied Meteorology, 5, 726-727, 1966.
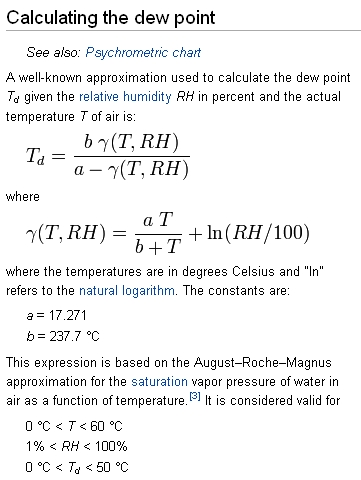
There are several approximate ways to calculate dew point temperature based on
air temperature and relative humidity. Here is a calculation from Wikipedia:
The Reitan and Smith formulas use temperature in °F, so convert from °C:
Td,°F = Td,°C•(9/5) + 32
Then:
PWReitan = exp(-0.981+0.0341•Td,°F)
PWSmith = exp[0.1133 - ln(λ + 1) + 0.0393*Td,°F]
where the λ value is chosen from this table based on latitude and season:
| Latitude | Winter | Spring | Summer | Fall |
|---|
| 0-10 | 3.37 | 2.85 | 2.80 | 2.64 |
| 10-20 | 2.99 | 3.02 | 2.70 | 2.93 |
| 20-30 | 3.60 | 3.00 | 2.98 | 2.93 |
| 30-40 | 3.04 | 3.11 | 2.92 | 2.94 |
| 40-50 | 2.70 | 2.95 | 2.77 | 2.71 |
| 50-60 | 2.52 | 3.07 | 2.67 | 2.93 |
| 60-70 | 1.76 | 2.69 | 2.61 | 2.61 |
| 70-80 | 1.60 | 1.67 | 2.24 | 2.63 |
| 80-90 | 1.11 | 1.44 | 1.94 | 2.02 |
The Reitan and Smith values are only approximately the same. Nonetheless, it is interesting to examine the correlation between an IR
thermometer calibrated to give PW and one or the other of these values.