Are Calibrations for Commercial Instruments Accurate?
A Group Exercise
David Brooks, June 2011
When you buy a commercial instrument for making scientific measurements, it is reasonable to expect that it gives
the "correct" value for whatever it is designed to measure. But, the "correct" value is always a matter of interpretation, with degrees of
uncertainty that may or may not be significant for the intended measurement. This exercise is intended to provide
some insight into the interpretation of measurements, especially with instruments that provide digital readouts. It
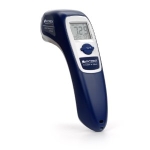
uses Kintrex IRT0421 non-contact IR thermometers, available from
sources such as Amazon for less than $50, to measure the surface temperature of the ground. The IRT0421 is typical of these kinds of instruments,
which are available from several different manufacturers. They all work basically the same way. You point them at a target and squeeze a "trigger."
On many models, including the IRT0421, the center of the target is illuminated with a red
laser dot. With the IRT0421 and similar devices from other manufacturers, the diameter of the circular surface area being measured is 1/12 the distance from the instrument to the surface.
That is, if the surface is 1 m
away, it measures the average temperature of a circular area about 8 cm in diameter. The IRT0421 and similar instruments are calibrated assuming a fixed
surface emissivity
of 95%, which is typical for a wide range of natural and manmade surfaces. The
specifications for this device are shown here.
|  |  |
What are we to make of these specs? The first thing to notice is that, as is typical of lower-cost digital instruments, the resolution of the digital readout, 0.1° C or F,
has not much to do with the claimed accuracy of the instrument — 1°C over much of its range.
Why is this true? Because it is cheap and easy to add another digit in a digital display. But, the actual measurement depends on the analog response of a sensor to incoming
longwave (thermal) radiation and it is neither cheap nor easy to improve the accuracy of this response.
So, even though it
makes sense to record the all the digits displayed, it is important to recognize that this does not mean
temperatures are accurate to within 0.1°! (They may or may not even be reproducible within 0.1°.)
An additional problem is that it is tempting to interpret an accuracy stated as "+/- (something)" as representing a random error so that several readings can be averaged to get a
more accurate result. But, this is not necessarily true! The specifications on these instruments are actually more likely to represent biases —
systematic errors — than
random errors. As a result, whenever instruments are used by themselves to collect data, or when data from several "identical"
instruments are going to be compared, it is absolutely necessary to understand how those instruments actually perform when they are measuring the same thing.
Data Collection:
Establish a protocol that will allow several "identical" instruments to be compared.
- Give each of 10 Kintrex IRT0421 IR thermometers IDs 1-10. Mark these IDs on the instruments with a piece of masking tape or in some other legible
fashion.
- Make 10 data entry sheets, with a site ID and spaces for entering readings from each of the 10 thermometers.
- Conduct the experiment during a part of the day when temperatures are not changing quickly and clouds aren't moving quickly.
- Have 10 people select 10 different sites, in a line several feet apart on a reasonably uniform surface (like a grass lawn or unbroken concrete or asphalt pavement).
The line should be
established so that the sun is in front of you, with shadows behind you.
- Make sure the thermometers are set to display temperatures in °C.
- If you need practice using these thermometers, do that now.
- Distribute the 10 thermometers in order, left to right. Pass out the site sheets, numbered left to right.
- Take a reading (everybody at roughly the same time). Hold the thermometer out in front of you, away from your body, and point it straight down at the ground.
Pull the trigger and hold it for about 5 seconds. The instrument will "hold" the reading so you can look at the display when you're done with the measurement.
Record the average (the large digits).
Ignore the "MAX" reading displayed in smaller digits. (NOTE: Depending on how bright the sun is, you may not be able to see the red laser spot. This doesn't matter.)
- Quickly pass your thermometer to the person on your right. The rightmost person brings his/her thermometer to the person at the leftmost site.
- Repeat until each person has recorded 10 values, one for each thermometer. Do NOT try to guess what the temperature will be. Record what you see!
- Record measurements with each thermometer in the order in which you collect the data. Suppose the thermometers are numbered 1-10, and are
distributed in that order, left-to-right along the sites. If you are the third person from the left, you would enter readings in the order
3, 4, 5, 6, 7, 8, 9, 10, 1, 2. Do NOT reorder the readings 1-10.
- If an 11th person and instrument are available, record 10 measurements along with the people standing in a line, using the same instrument
for all the measurements.
Data Analysis:
There are three basic questions to be addressed:
1. Are there any obvious "outliers" in your data? If so, do you know why they are there?
2. Is there a systematic change in the observed temperatures from when you started the exercise to when you finished?
3. How well do the 10 instruments agree among themselves when they are measuring the same spot on the ground at roughly the same time, This time should be short
relative to a length of
time when the temperature surface could be expected to change significantly — see the second question.)
- Examine all 10 of your readings. Are there any that look obviously "wrong"? If so, what should you do with them?
- Plot the temperatures taken with the 10 different instruments. Use the instrument IDs as the x-axis values, in the same order as you collected
the data. If the experiment proceeded smoothly, these x-values should be at approximately equal time intervals. Observe whether there is a systematic
increase or decrease in temperature during the duration of the experiment.
- If you have 10 readings with one instrument (see the last step in the "Data Collection" section), plot those results as a function of time, too.
- Calculate the mean and standard deviation for the 10 readings. If the surface temperature changes systematically
during the course of the experiment, assume that change can be described by a straight line ( T = a + bx), calculate the best fit values for a and b, and calculate
the standard deviation around that straight line.
(You could use Excel's built-in functions and line-fitting capabilities for these calculations.)
- Does this exercise indicate that there are significant differences among these instruments? How will you define a "significant" difference?
- How would you use the results of this exercise when you design an experiment where multiple thermometers will be used to
measure different surfaces in different places
and at different times? Are there other instrument checks you should make? Can you think of ways to check the absolute accuracy of the measurements? (What is the temperature of
a large bowl of ice water, 50% ice, 50% water stirred for a few minutes? Of a large pot of boiling water?) Is it possible that these instruments are not accurate enough for a proposed
experiment?