David R. Brooks, PhD

President
Institute for Earth Science Research and Education
2686 Overhill Drive
Eagleville, Pennsylvania 19403 USA
Phone: 610-584-5619
E-mail: brooksdr@instesre.org
Some of the work described on this site has been made possible by support from the National Science Foundation, the National Aeronautics and Space Administration, the National Oceanic & Atmospheric Administration, and the Toyota USA Foundation. Click here for policy statements concerning this website.

November 11, 2021,
Wild cherries (Prunus avium?)

      2023 was a banner year for fruit
trees in our area. Thes wild cherries
are from a a tree that hangs over our
driveway.

You can now use your PayPal account to purchase instruments from IESRE.

Environmental and Climate News contains links to a variety of newsworthy articles and other resources about Earth's changing environment and climate.

Exploring Your Environment with Arduino Microcontrollers
David R. Brooks

      This 2023 book shows how to use Arduino microcontrollers to monitor the natural and manmade environment, with a focus on the opportunities and limitations associated with using Arduino-compatible sensors.
      HERE is a webpage that supports the book with updates and links to code and color versions of many of the book's figures. This webpage also includes links to other documents about using Arduinos.
      You can get this book directly from IESRE. All proceeds go toward supporting IESRE's mission. IESRE doesn't accept credit cards, but you can pay by check to Institute for Earth Science Research and Education at the address above, or by PayPal to brooksdr@instesre.org. The cost is $25 including shipping to any U.S. address. If you pay with Paypal, IESRE would appreciate it you could add an extra $2 to help with transaction fees. Thanks!


NEW! Web page in support of ECoSTEM project with Xavier University of Louisiana
      IESRE is a consultant on the three-year Environmental Computing and Community Engagement in STEM Education project, funded by the National Science Foundation and started in February 2021. HERE is a link to a web page about this project.

NEW! Arduino-Based Handheld UV Index meter
     THe link below to the webpage supporting Brooks' new book now includes a link to a document describing how to build an Arduino-based handheld UV Index meter.

NEW! Document describing how to use several Arduino-compatible devices for displaying data
      Click HERE for a PDF document showing how to display data collected with Arduinos. The document discusses the serial print functions and LCD, TFT, and e-ink displays. There is also a link to a newer document about using OLED displays.
NEW! Insolation Data from my Site
HERE is a link to a web page showing monthly insolation data taken at my site, starting in August 2018. The data are collected with an IESRE pyranometer, a Kipp & Zonen SP-Lite pyranometer, and an Onset Computer Corporation UX120-006 4-channel 16-bit data logger, at one-minute intervals.
NEW! Interfacing an Arduino with a Geiger Counter
HERE is a link to a web page that shows how to interface an Arduino UNO with a Geiger counter from MightyOhm.com. This project uses Arduino's hardware interrupt capabilities to count pulses from the Geiger counter and calculate counts per minute.
NEW! Creating Time Lapse Videos with Arduino Microcontrollers
HERE is a link to a web page showing how to create simple time lapse videos with a small Arduino-compatible camera. This is useful for monitoring sky conditions, flooding, light-sensitive flowering plants, etc.
NOTE: This document has been updated to include using a simpler "mini spy camera" from adafruit.com. This device uses very simple code to trigger a camera to take videos or still images at programmed intervals and automatically store them on an included microSD card module (SD card not included).
NEW! A Packet Radio Weather Station
HERE is a link to a web page describing how to build a simple weather station that uses two Adafruit packet radio boards with Arduino Pro Mini and UNO boards to send and receive temperature, relative humidity, and barometric pressure data from DHT22 and BME280 sensors.
NEW! Build your own Stevenson screen
      HERE is a link to a short document showing a Stevenson screen I built using vinyl shutters (from Home Depot) and some 1" x 12" pine boards. Commercial Stevenson screens are VERY expensive, so it is worth looking into making your own. You will need some basic woodshop equipment.
NEW! An Arduino-based Particulate Monitoring Station
      HERE is a link to a document that details how to construct an Arduino-based particulate sampling system using a laser-based Plantower PMS5003 device that measures PM1, PM2.5, and PM10 concentrations. It includes a DHT22 temperature/relative humidity sensor and an UNO-compatible data logging shield to store data with a date/time stamp.

Air quality parameter monitoring for ozone and PM2.5 is back in Norristown, PA.
      The DEP monitoring site in Norristown is only a few miles from my home. In 2015, PM2.5 monitoring was discontinued at this site, but it has now restarted. Real-time AQI values from monitoring sites in Pennsylvania can be found HERE and nationally, HERE. The Norristown site reports only 1-hr ozone and PM2.5 values. These values have been used in recent studies of the relationship between air quality and sky color.
Links to several documents relating to using Arduino microcontrollers have been moved to their own web page.
Here is a link to some data resources from the Climate Literacy Network.
See our News link for information about a NASA Technical Memorandum which assesses an inexpensive method for measuring total column water vapor based on a 2011 paper by Mims, Chambers, and Brooks. Links to the original BAMS paper and the NASA Technical Memorandum are provided. These measurements are ideal for student research projects.
Here is a link to a web page that shows how to create a .kml file that will display the location of all of NOAA's Climate Reference Network sites on Google Earth's global map. You can "tag" each site with additional information. This kind of display is a big improvement over using 2-D maps! The web page isn't a tutorial on the KML "language," which is structured much like HTML, but there is a link to a nice online tutorial. There is also a template for creating .kml files from Excel. There will be a permanent link to this page under the "How Do I...?" tab.

Find NOAA U.S. Historical Climatology and Climate Reference Network sites near you.
This online application lets you find USHCN and CRN sites within a specified longitude/latitude box. You can display a list of the sites or generate a .kml file for displaying the sites on a Google Earth global map.
Student Climate Science Inquiry and Research Projects
David Brooks' new document, Climate Science Inquiry and Research Projects for Students: Earth's Radiative Balance, is a result of project development carried out during IESRE's three-year, NASA-funded Climate Science Research for Educators and Students. This document begins with an an introduction to Earth's radiative balance and using data loggers to collect data. It then describes projects for measuring total solar radiation at Earth's surface, surface reflectance, surface and sky thermal radiation, sky photography, and using existing data to examine climate trends in the U.S. The PDF version of the document can be downloaded HERE.
      This early version of the document represents a work in progress, but IESRE hopes that students and teachers will find it helpful as they plan for science fair projects in 2014. Your comments and suggestions are, as always, welcome.
Creative Commons License
Student Climate Science Inquiry and Research Projects by David R. Brooks is licensed under a Creative Commons Attribution-NonCommercial-NoDerivatives 4.0 International License.
2014 UPDATE ON CLIMATE DATA ACCESS APPLICATIONS A SINGLE WEB PAGE is now available for accessing NOAA's Climate Reference Network data through the end of 2013, including additional insolation data and including a clear-sky model; the US Historical Climatology Network; 30-year climate normals (currently 1971-2000 and 1981-2010).
Notes from a Temperate Climate. A site dedicated to students, teachers, and my friends living in Thailand's tropical climate.


This graph of barometric pressure recorded during Hurricane Irene in 2011 and "super storm" Sandy in 2012 dramatically illustrates the passage of these storms through our area. Many sites, including a small airport site near IESRE were not operational during the height of Sandy. Amazingly, we did not lose electrical power during either of these storms even though both storms resulted in widespread power losses – millions of people throughout the northeast lost power during Sandy.


Links to some other useful and interesting material:  
This very nice site from AirNow provides real time access to AQI values from across the country and other places around the globe.
This website provides photos from space of the entire Earth, updated daily.

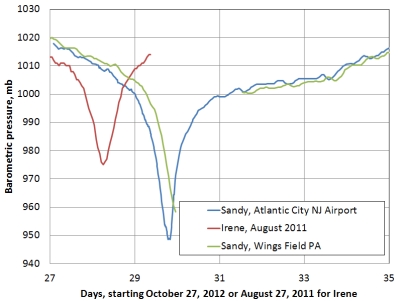
PDF versions of Brooks' PowerPoint presentations from June 2012 GLOBE/Europe-Eurasia Annual Meeting, Utrecht, The Netherlands:
A History of Student Sun Photometry
Student Pyranometry
• (for information about monitoring surface radiating temperature, see this link.)


Presentations from the Asia-Pacific Regional GLOBE Learning Expedition, Hua Hin, Thailand, 13-18 November, 2007:
      Student Climate Change Research, 2008-09 version (9.4 MB PowerPoint document)
Spreadsheet model for "designing" your own planet
Our Fox Family, 2006
Calculate solar position and the time of solar noon at your coordinates.
Set your watch or clock accurately. Use the UTC "time zone" to display the internationally accepted time for reporting scientific data.
Link to current weather conditions in Pennsylvania (Get other states by changing "pa" to another two-letter state code.)
Link to weather during past 24 hours at Wings Field, Blue Bell, Montgomery County, PA
My local weather and forecasts
(Look here for weather during past 24 hours at other places.)
Historical weather data around the globe
More historical climate data around the globe
Link to DEP air quality monitoring information for Pennsylvania
Naval Research Lab's Navy Aerosol Analysis and Prediction System Global Aerosol Model (NAAPS)
National Weather Service description of meteorological station model symbols